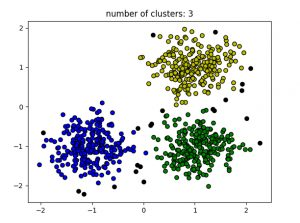
DBSCAN is one of the famous clustering algorithm. Spatial clustering of density-based applications (DBSCAN) is a well-known data clustering algorithm widely used in data mining and machine learning. Based on a set of points (let's think in a 2-dimensional space), DBSCAN groups together points that are close to each other based on a distance measurement (usually Euclidean distance) and a minimum number of points. It also marks the points in low-density regions as outliers. DBSCAN can find non-linearly separable clusters.
DBSCAN(DB, distFunc, eps, minPts) {C = 0 /* Cluster counter */for each point P in database DB {if label(P) ≠ undefined then continue /* Previously processed in inner loop */Neighbors N = RangeQuery(DB, distFunc, P, eps) /* Find neighbors */if |N| < minPts then { /* Density check */label(P) = Noise /* Label as Noise */continue}C = C + 1 /* next cluster label */label(P) = C /* Label initial point */Seed set S = N \ {P} /* Neighbors to expand */for each point Q in S { /* Process every seed point */if label(Q) = Noise then label(Q) = C /* Change Noise to border point */if label(Q) ≠ undefined then continue /* Previously processed */label(Q) = C /* Label neighbor */Neighbors N = RangeQuery(DB, distFunc, Q, eps) /* Find neighbors */if |N| ≥ minPts then { /* Density check */S = S ∪ N /* Add new neighbors to seed set */}}}}/* credit: wikipedia */
# credit: geeksforgeeksimport numpy as npfrom sklearn.cluster import DBSCANfrom sklearn import metricsfrom sklearn.datasets.samples_generator import make_blobsfrom sklearn.preprocessing import StandardScalerfrom sklearn import datasets# Load data in Xdb = DBSCAN(eps=0.3, min_samples=10).fit(X)core_samples_mask = np.zeros_like(db.labels_, dtype=bool)core_samples_mask[db.core_sample_indices_] = Truelabels = db.labels_# Number of clusters in labels, ignoring noise if present.n_clusters_ = len(set(labels)) - (1 if -1 in labels else 0)print(labels)# Plot resultimport matplotlib.pyplot as plt# Black removed and is used for noise instead.unique_labels = set(labels)colors = ['y', 'b', 'g', 'r']print(colors)for k, col in zip(unique_labels, colors):if k == -1:# Black used for noise.col = 'k'class_member_mask = (labels == k)xy = X[class_member_mask & core_samples_mask]plt.plot(xy[:, 0], xy[:, 1], 'o', markerfacecolor=col,markeredgecolor='k',markersize=6)xy = X[class_member_mask & ~core_samples_mask]plt.plot(xy[:, 0], xy[:, 1], 'o', markerfacecolor=col,markeredgecolor='k',markersize=6)plt.title('number of clusters: %d' %n_clusters_)plt.show()